Your own dashboard
See your website working for you, in plain English.
Most website statistics are built for marketing teams: charts, jargon and numbers that don’t tell you much. Your dashboard is built around one question: is your website bringing you work?
It comes with every website we build, on your own web address, for you to sign in to whenever you like. While you get on with the job, it keeps count.
What it tells you
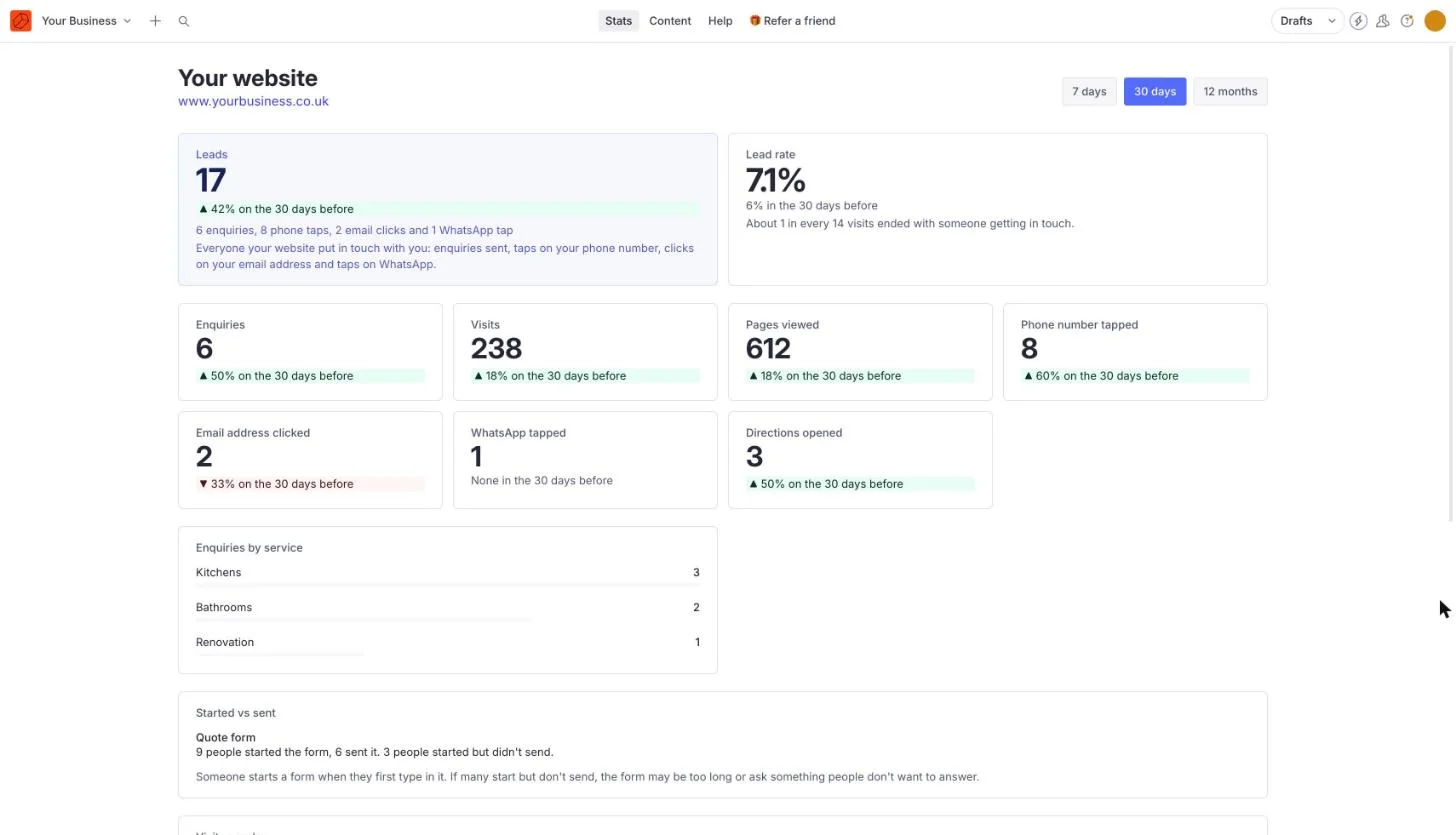
Your figures, in sentences like these. For the last 7 days, 30 days or 12 months. (The figures here are examples.)
-
“17 people got in touch through your website in the last 30 days: 6 enquiries, 8 phone taps, 2 email clicks and 1 WhatsApp tap.”
The one figure that answers “is my website bringing me work?”. Every way someone can get in touch, added up.
-
“About 1 in every 14 visits ended with someone getting in touch.”
Whether your website turns visitors into customers. If it drops, something on the site may be putting people off.
-
“Up 42% on the 30 days before.”
Every figure is compared with the period before, so you can see whether things are getting better, and when you’re heading into a quiet patch.
-
“Kitchens: 3 enquiries. Bathrooms: 2. Renovation: 1.”
Which of your services people are asking about, so you know what’s in demand and what to show off more.
-
“9 people started your quote form, and 6 sent it.”
If lots of people start the form but don’t send it, it may be too long or ask something people don’t want to answer. Worth knowing.
-
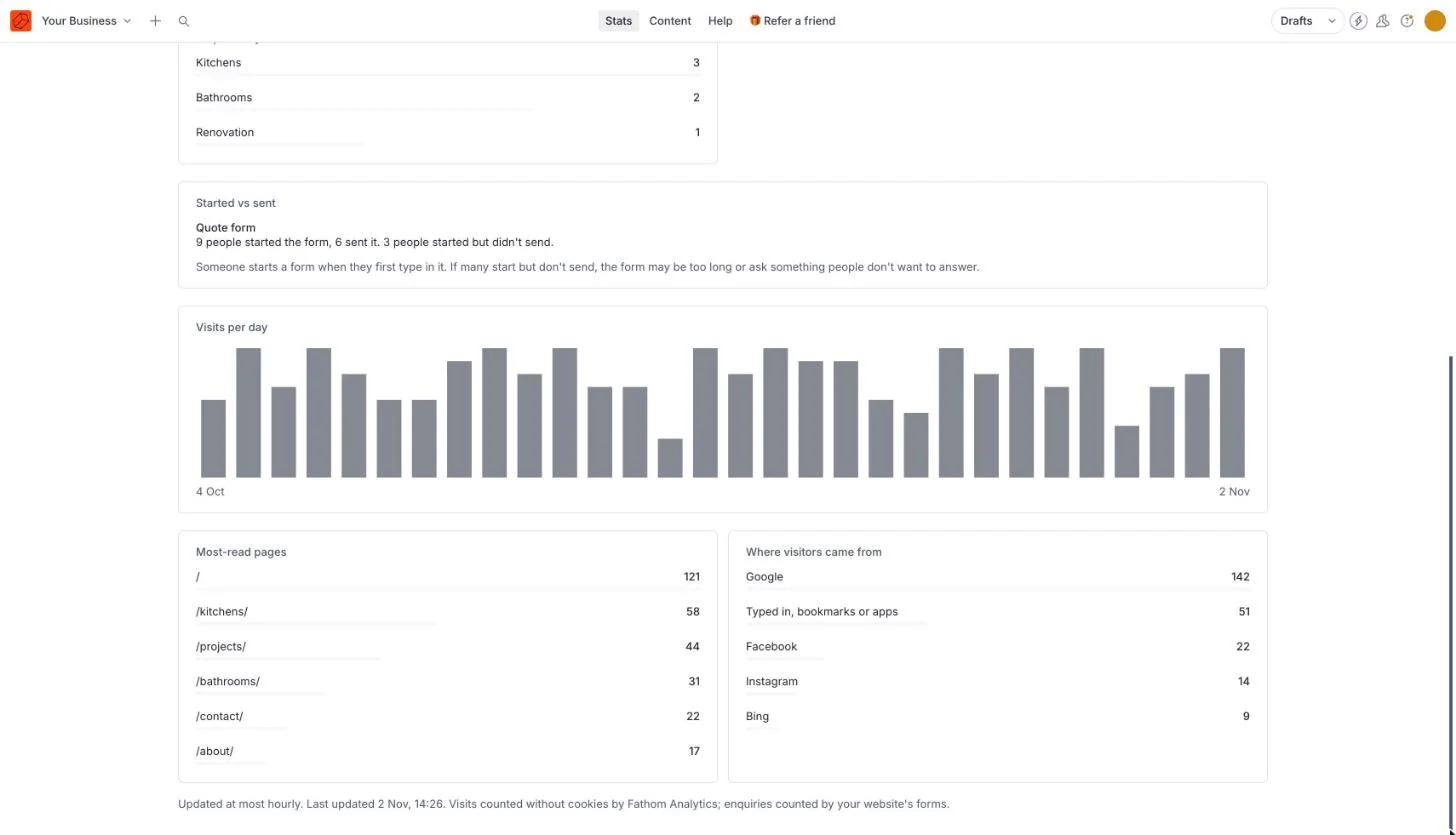
“142 of your 238 visits came from Google.”
Where your visitors come from: Google, Facebook, people typing your address in. It shows which of your efforts are paying off.
Set up around your business
-
What counts is up to you
We set it up around how your customers get in touch: enquiries, phone calls, emails, WhatsApp or booking requests, whichever matter to your business.
-
Counts you can trust
Your website counts its own enquiries as they arrive, so ad blockers can’t hide them, and test messages are left out.
-
No cookies, no banner
Visits are counted without cookies, so your visitors never see a cookie banner, and nobody is tracked around the internet.
-
Private to you
Only you, and anyone you invite, can sign in and see your figures.
Keep your website up to date yourself
-
Change it yourself
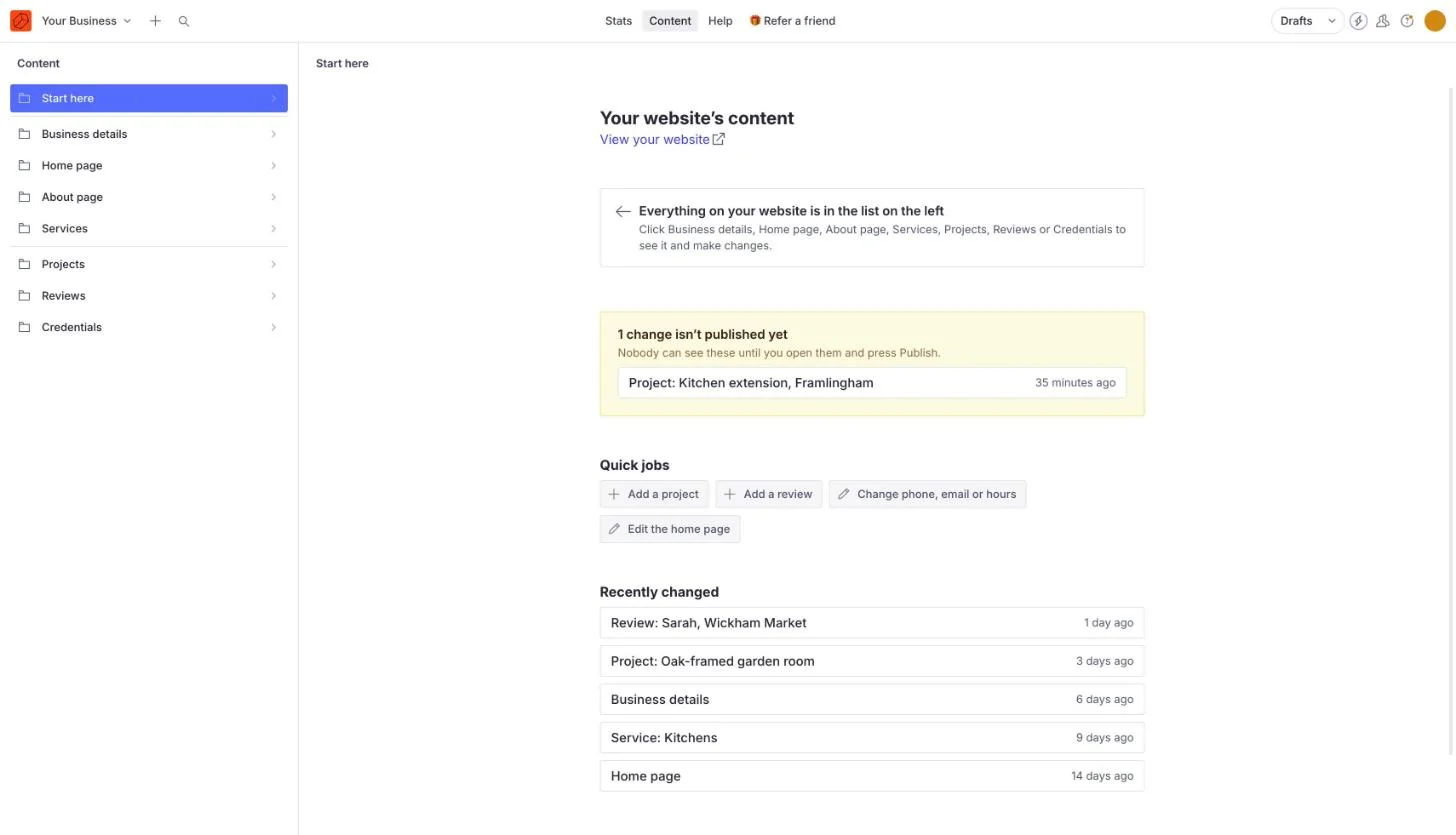
Your words, photos, prices and opening hours, in a simple editor with nothing technical to learn. Changes go live about a minute after you publish.
-
Nothing forgotten
It shows anything you’ve started but not published yet, and the jobs you’ll do most are one click away.
-
Help built in
A short, plain-English guide is always there under Help, and you can always ask us.
Included with every website
There’s nothing extra to pay. On the care plan we go through your figures with you every three months, and on the Growth plan every month, with what’s worth doing next.
-
Simple site
Put me online and look credible
£550 + VAT12 months free hosting
Learn more about the Simple site → -
Business site
Help me win new customers
£1,500 + VAT12 months free hosting
Learn more about the Business site → -
Something bigger
Shops, bookings, several locations, or a fresh start
Priced individually
Learn more about bigger projects →
Want a website you can see working?
Tell us about your business and we’ll tell you, honestly, what we’d do first. No pitch, no obligation.
Get in touch